As a Goan, fish is the unmissable item in my daily diet. Fish being the integral part of the Goan psyche, no Goan can live even a single day without it. Recently, however, I had an encounter with a different kind of fishy business at the Ayushman Arogya Mandirs (AAM), formerly called Health and Wellness Centres, which I am mentoring under the scheme wherein medical colleges mentor the AAMs to help them achieve their full potential.
As two of the AAM where due to undergo National Quality Assurance Standards (NQUAS) certification, there was a need for intense documentation. One of the unusual requirements was documentation of a root cause analysis of a challenge or problem using the fishbone diagram. Naturally, the Community Health Officer (usually a Nurse or an AYUSH doctor) who leads the AAM was at loss as to how to construct the fish bone diagram although they were well aware of root cause analysis. They turned to me for advice and handholding to prepare or construct the Fish Bone diagram.
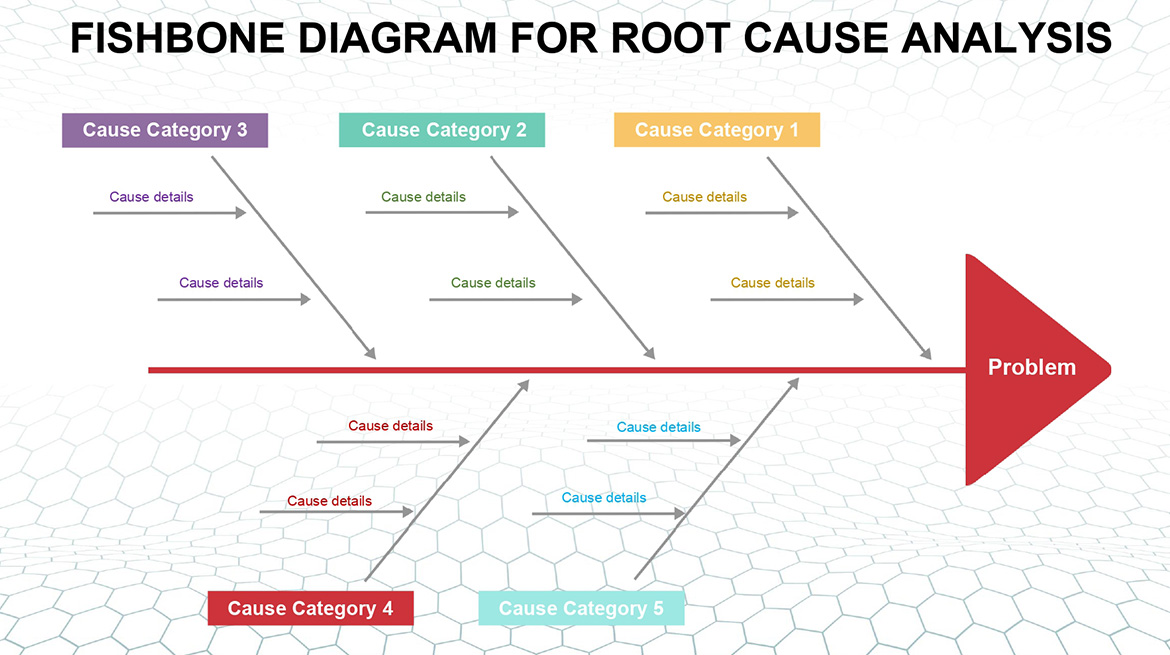
What is a Fish Bone Diagram?
Japanese Professor Kaurou Ishikawa was the first person to describe the cause of a problem using a visual diagram, now known as the fishbone diagram or Ishikawa diagram[1]. It is now considered a key diagnostic tool for analysing and illustrating problems in root cause analysis.
A fishbone diagram resembles mimics a fish skeleton. The underlying problem is depicted as the fish’s head, placed on the right and the causes extend to the left as the bones of the fish skeleton, the ribs branch off the back and denote major causes, while there may be sub-branches to denote root causes[2].
A cause-and-effect chart, such as fishbone analysis, provides a tool to identify all the possible causes of a problem not just the obvious ones. It seeks to locate the “root” of the problem from a systemic perspective rather than through personal blame[3].
The utility of Fishbone diagram in healthcare is immense. Barriers, challenges, problems are an integral part of healthcare management and services delivery. Root cause analysis through stakeholder engagement can uncover hitherto unknown reasons and causes of seemingly intractable problems and challenges. Fishbone diagram then gives wings to the root cause analysis by giving it a stunning and appealing visual dimension.
End note:
Through extensive brainstorming we were able to successfully analyse a problem at the AAM deep down to its roots and prepare up a visually appealing, colourful fishbone diagram displaying the entire spectrum of the causes of the problem.